Interactive Infographics for Thought Leadership Reports
- Agile Design Methods / Concept Designs / Digital Strategy / Healthcare / HTML/CSS/JS / Management Controls / Product Design / Product Strategy / Strategic Communications / Team Dynamics / UI/UXD / Web/Mobile Apps
- Interactive Infographics for Thought Leadership Reports
Interactive Infographics for Thought Leadership Reports
Design Tools
Adobe Edge Animate, Apple Books, Microsoft Office Suite
Categories
Skills
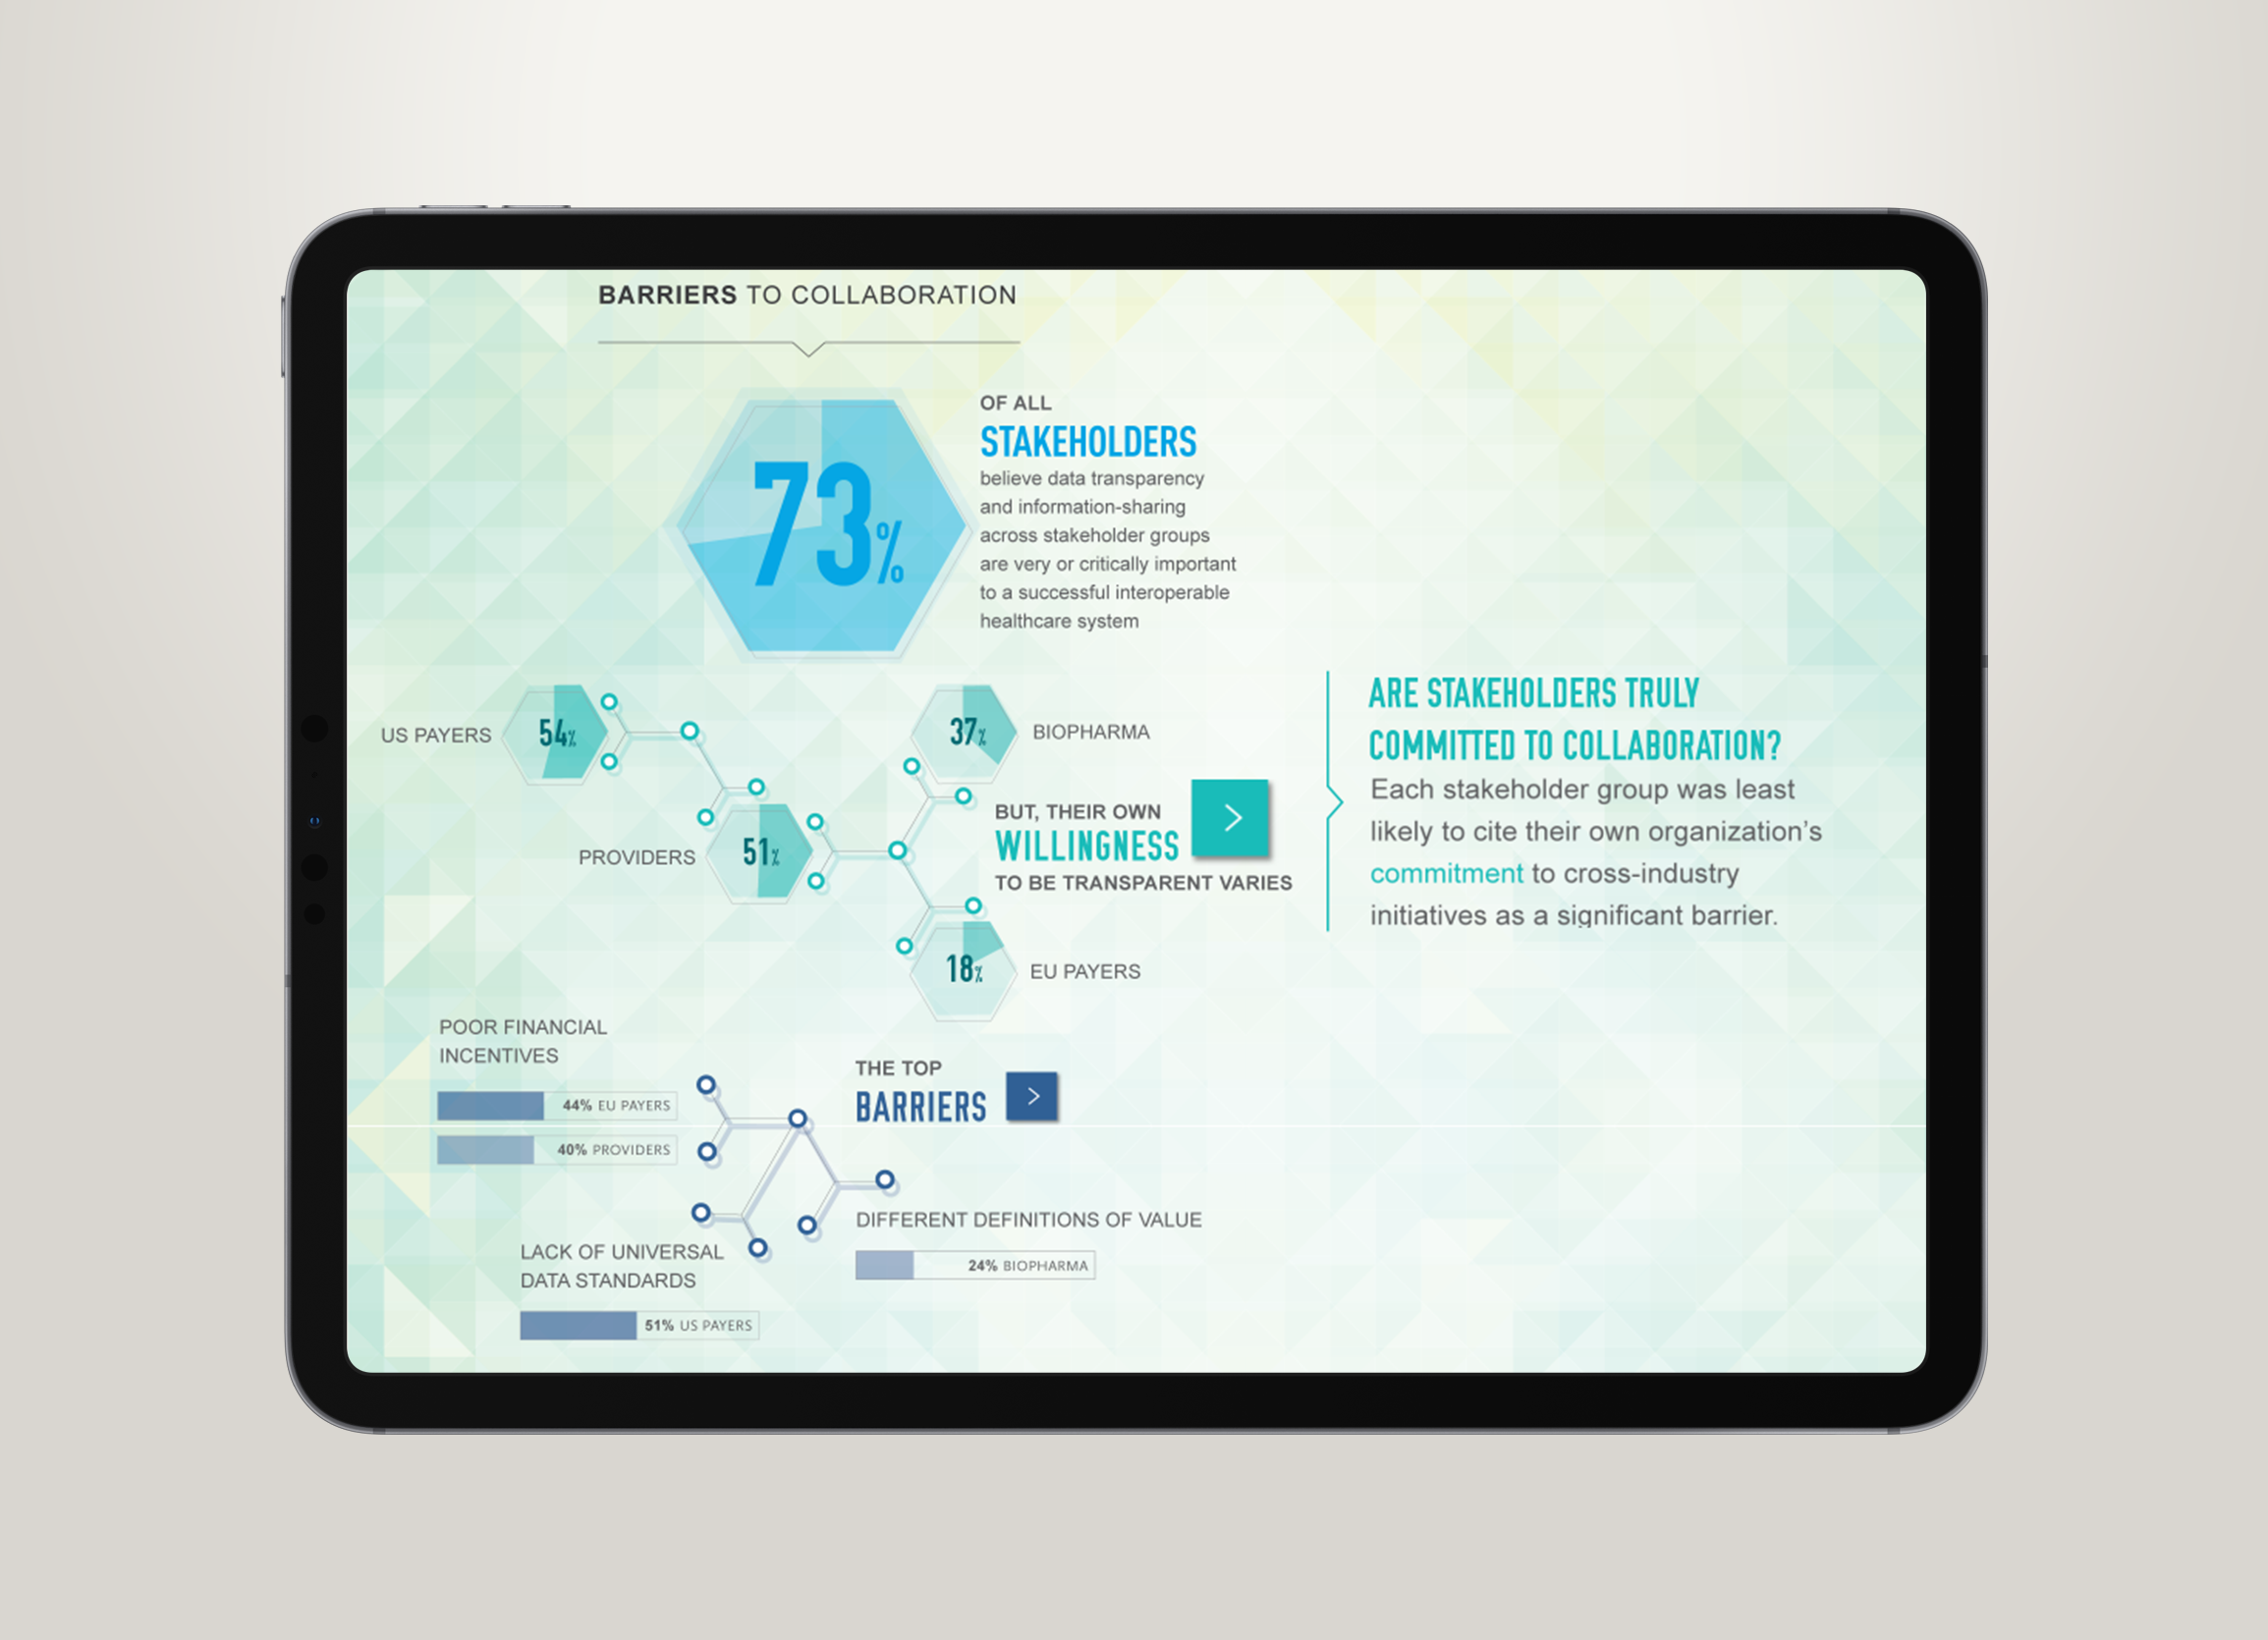
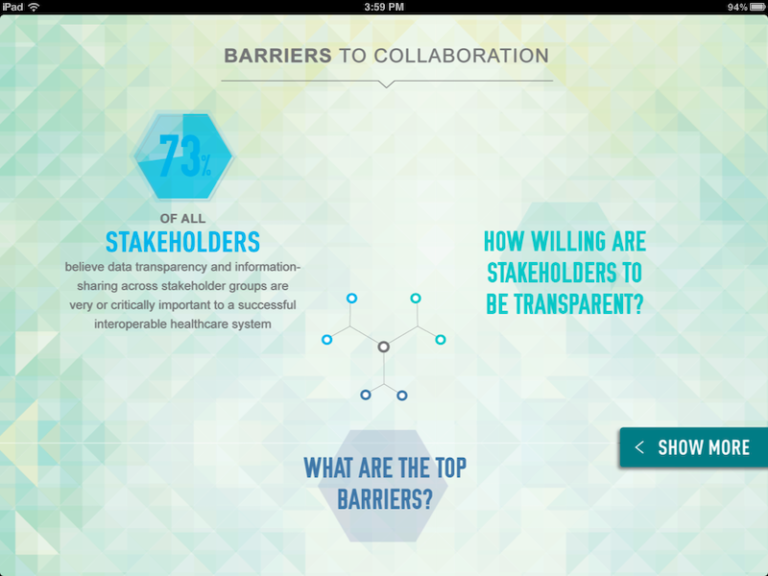
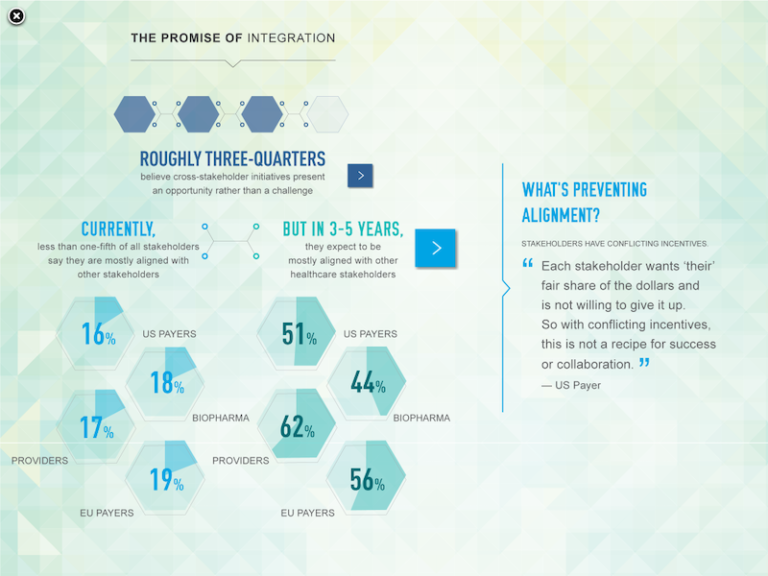
Communicating survey data effectively often means restructuring information so that it appeals to users who favor a more visual experience.
My pharmaceutical client wanted to demonstrate their ability to report key analysis to executives throughout the biopharmaceutical landscape in a manner that fosters engagement and information-sharing. I used Adobe Edge Animate to program a series of interactive infographics that would enable the target audience to engage the report’s findings in a more immersive, customizable medium. The report was exported as an Apple iBook (now called Apple Books) widget and then distributed and tracked using the iTunes platform.



![Title Slide for NAHSE case competition proposal addressing healthcare and housing instability in California's Bay Area. Text reads: [Line 1] Golden Health [Line 2] Bridge Program [Line 3] KSN Consulting Firm | Team Z](https://nclikenc.com/wp-content/uploads/2023/03/TeamZ_BridgeProgram_Title-271x198.png)
