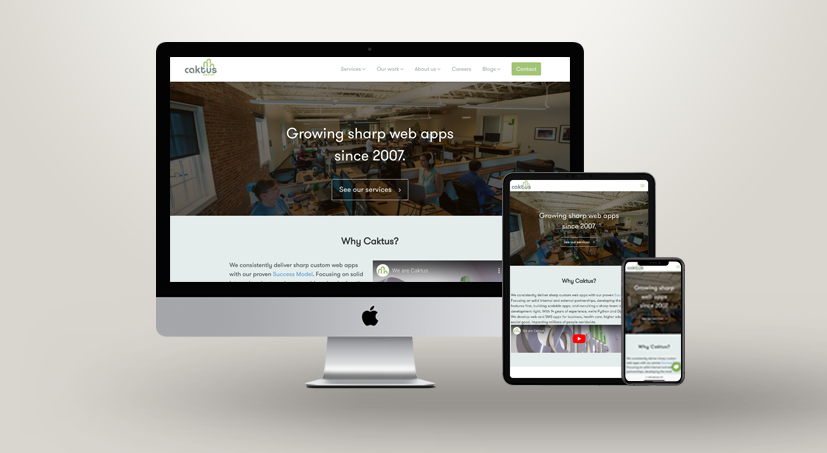
Open Data Policing Project North Carolina
- Digital Producer / Digital Strategy / Management Controls / Product Design / Product Strategy / Public Affairs / Redesigns / Social Impact / Strategic Communications / Technology / UI/UXD / Web/Mobile Apps / Websites
- Open Data Policing Project North Carolina
Open Data Policing Project North Carolina
Design Tools
Adobe Creative Suite, Axure RP, Moqups
Categories
Skills
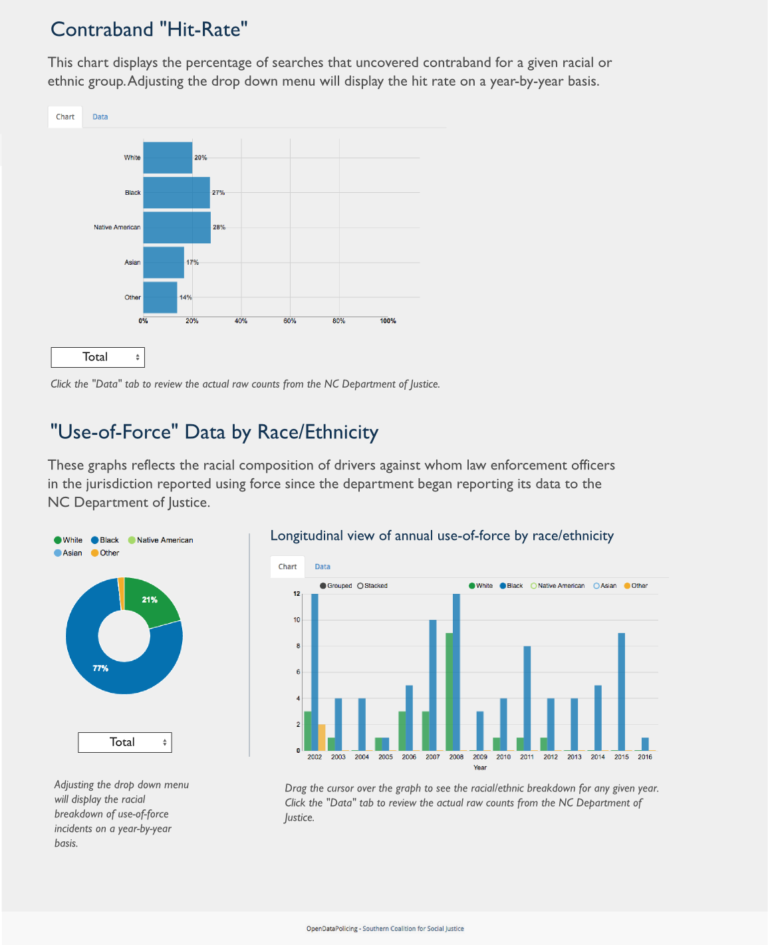
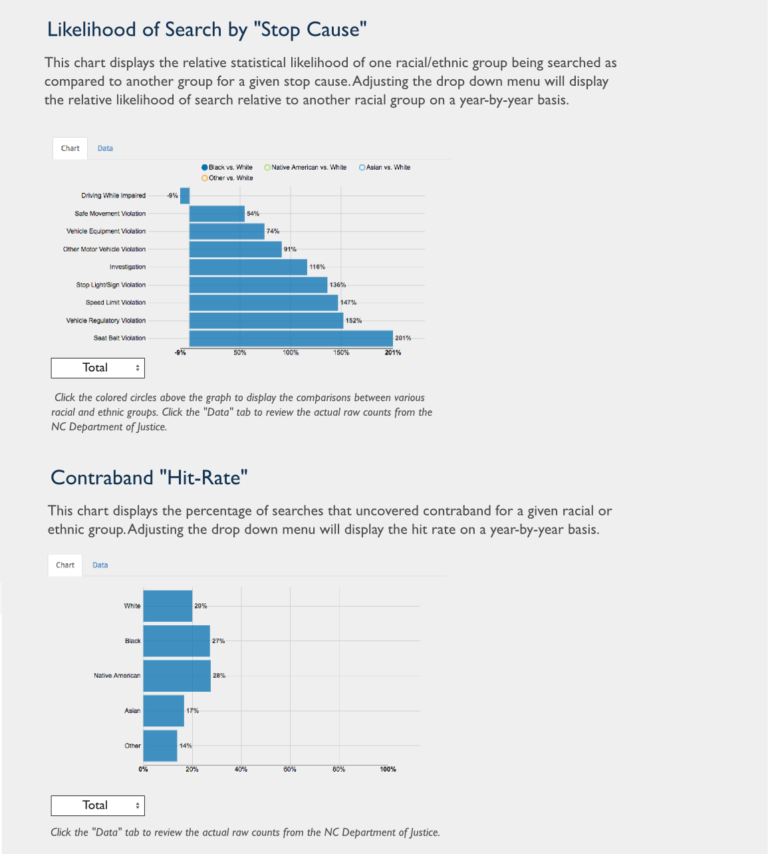
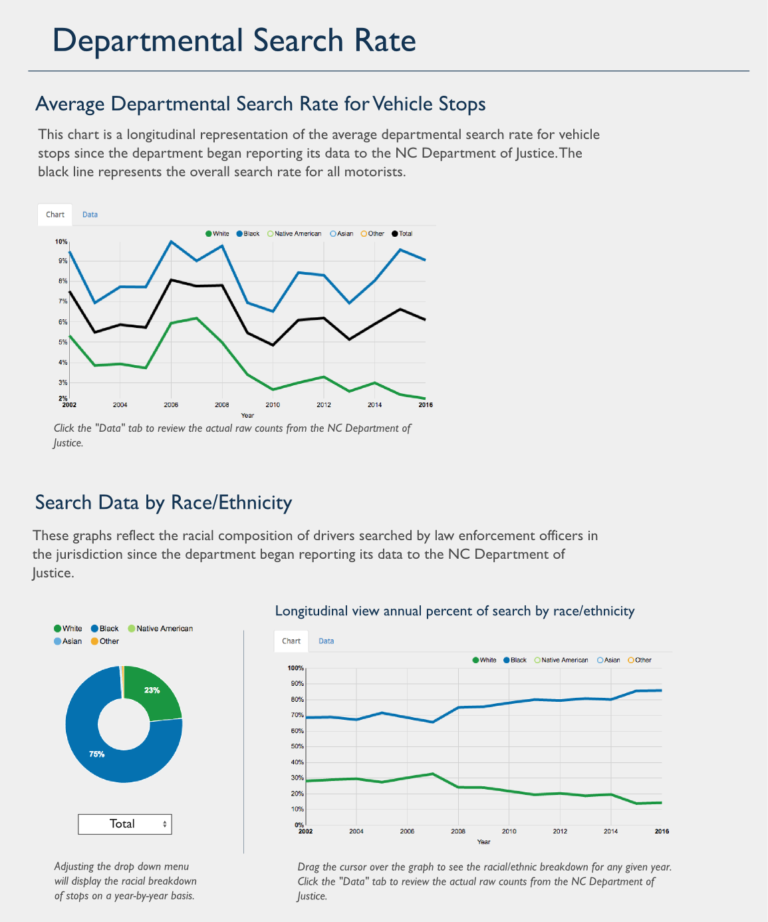
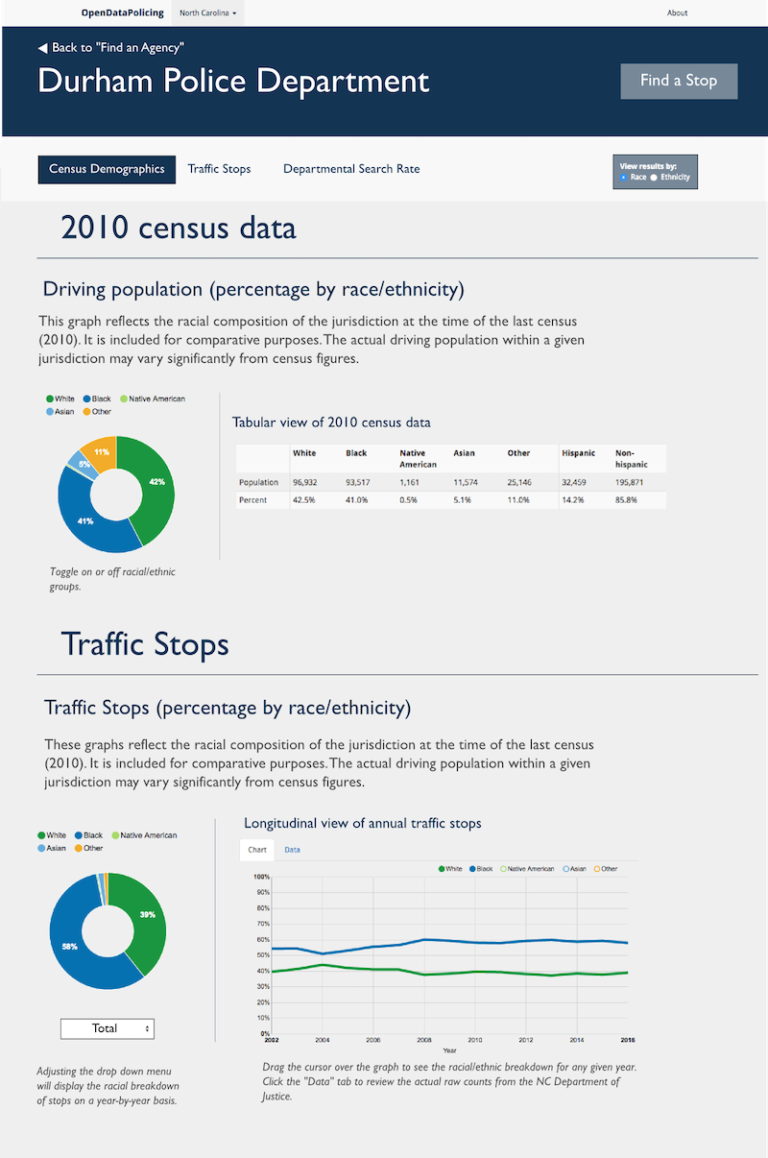
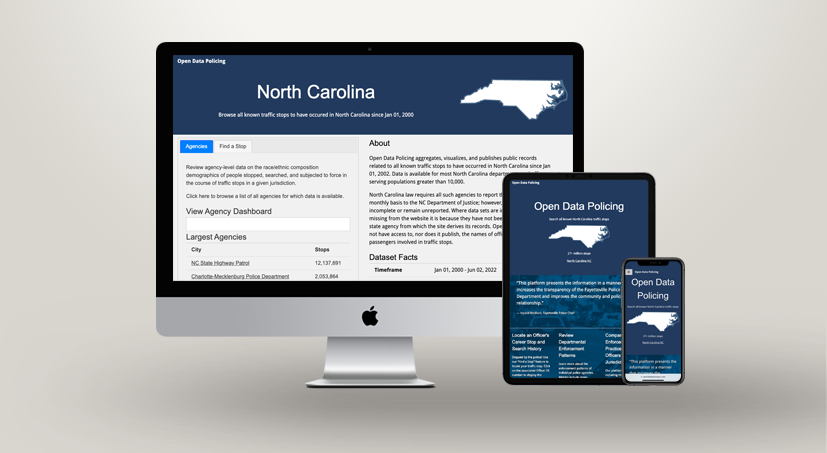
The Open Data Policing Project is a responsive website and platform inspired in part by the President’s Task Force on 21st Century Policing. Its goal is to make stop, search, and use-of-force data publicly available as a way to ensure transparency.
I learned about this project after one of my employer’s founders approached me about a passion project he’d been working on, and asked if I’d assist with UI/UXD. The website aggregates, visualizes, and publishes public records related to all traffic stops known to have occurred in North Carolina since 2002, and is updated after receiving data reports from the North Carolina Bureau of Investigation (NC SBI).
The project was quite complex. I participated in meetings to discuss how data is processed, interpreted, and normalized. My team and I worked through challenges with missing or incomplete data sets, differences in how data is collected or structured (not to mention how officers might report data), privacy issues (e.g., the identity of police officers or civilians involved in traffic stops), expected use cases/user groups, and data visualization planning/scoping.
In order for this project to be successful, we had to demonstrate our ability to meet the needs of our client (the legal organization that funded the project); account for the constraints and concerns of the NC SBI; and both optimize and contextualize a novel data visualization tool so that it is in the best position to aid social justice efforts and open access to information.
To be clear on one point: the site allows users to identify the enforcement patterns of individual officers associated with the traffic stop data—but the project team does not have access to, nor does it publish, the names of drivers, passengers, or officers involved in the traffic stops. The platform was later expanded to provide all traffic stop data for Illinois since 2005 and Maryland since 2013.
Featured Project Deliverables
Related Projects



![Title Slide for NAHSE case competition proposal addressing healthcare and housing instability in California's Bay Area. Text reads: [Line 1] Golden Health [Line 2] Bridge Program [Line 3] KSN Consulting Firm | Team Z](https://nclikenc.com/wp-content/uploads/2023/03/TeamZ_BridgeProgram_Title-271x198.png)
